

Intraday Trading: Are odds in your favor?
Intraday Trading: Are odds in your favor?
A data backed experiment to find out if Intraday Trading indeed has an outsized return possibility


If you are a retail investor, I am fairly certain that at some point in your investing journey you have toyed with the idea of Intraday trading. And while many walk away from this path after trying their hand at it, some purse it with utmost discipline and rigor and handful of them turn out to be star intraday traders. I devote this article to a small experiment on past data (of NIFTY 50), to see if Intraday trading truly is a low hanging fruit. Does it actually offer outsized reward possibility, the expectation of which lures most retail investor into it?
Intra Day Trading for the uninitiated, is simply buying a security (stock, currency, commodities etc.) and selling it (or selling and buying back) on the same day before the end of trading hours. Intention is to capture a smaller move within the day with a larger quantity of the security. A simplistic example would be while an investor buys 1 share and hopes for the stock to gain INR 100 over a period of time, an Intra Day trader buys 100 shares and hopes the stock gains INR 1 on that very day which he can then sell and book sweet profits!
For this experiment I would buy the NIFTY50 (benchmark Indian stock market index) at market open and sell it at market close for each trading day.
I will repeat this process for each day of my backtesting period, which for this experiment is last 10 years (2012-2022). Each day I will be able to capture (or maybe lose) some points which I will then add up for the entire duration of backtesting period i.e. 10 years. In essence I am trying to capture only the intraday movement of the index.
Financial markets (and life!) is all relative. So I will be interested in comparing the result of this experiment against a buy and hold during this entire period (2012-2022), which would be a typical long term investing style.
Its now time to look at what result this experiment presents to us!
Start Date: 25th Jan, 2012 (NIFTY = 5158.3)
End Date: 21st Jan, 2022 (NIFTY = 17,617.2)
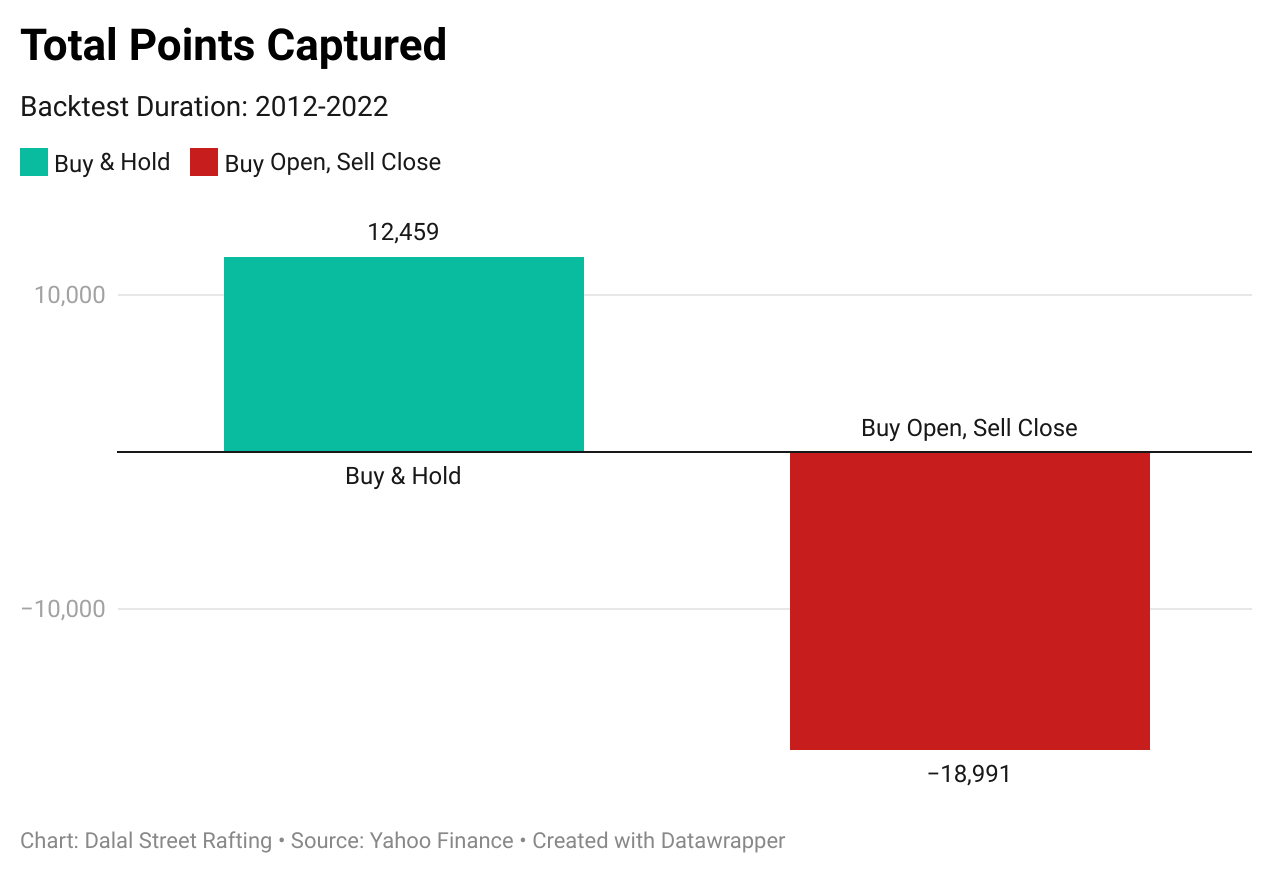
While NIFTY gained 12,459 points in this duration, it reversed more than that in Intraday. Amazing, isn’t it? To have even a better comparison it will be useful to compare the returns generated in this period.
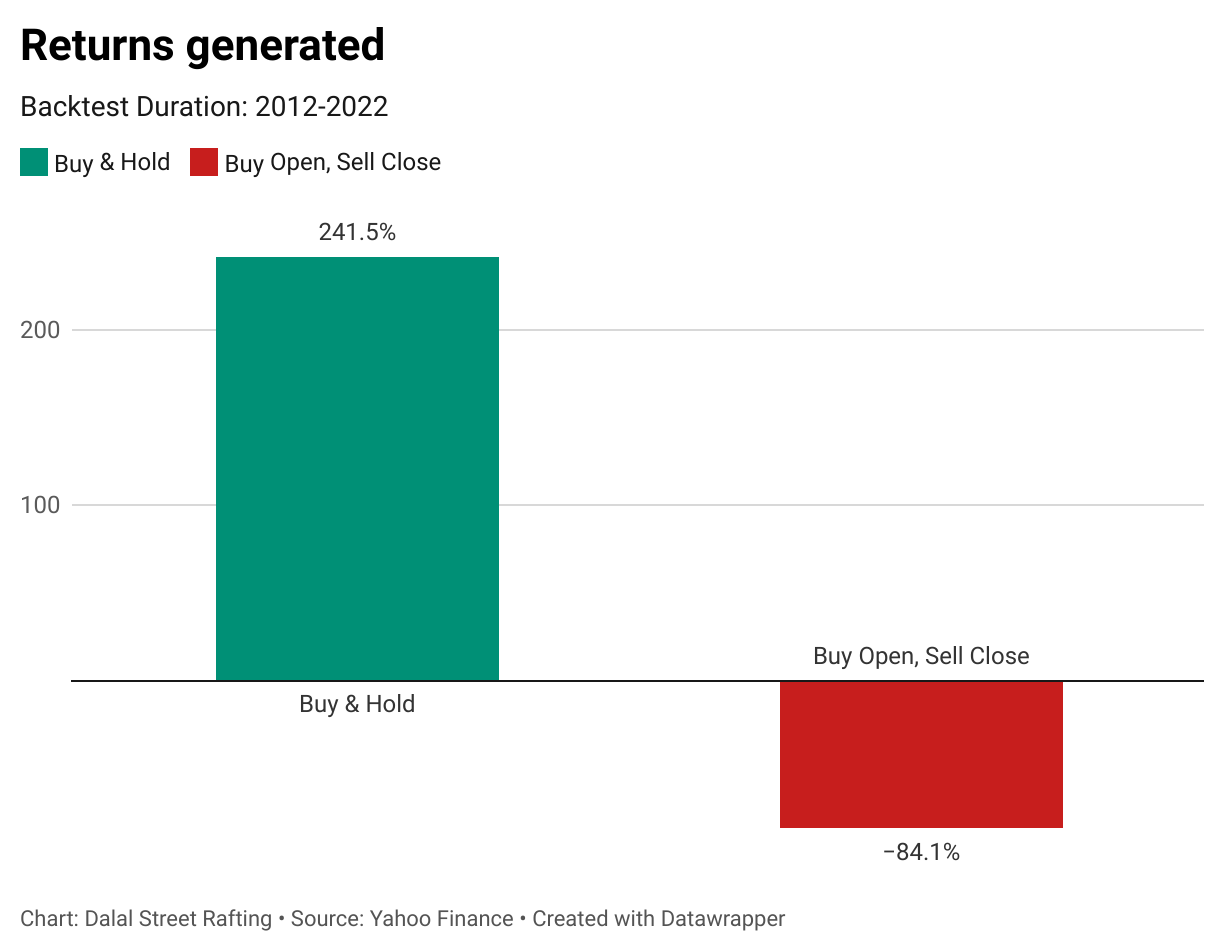
For the purpose of returns calculation, the returns are compounded. This ensures a like to like comparisons between both buy & hold and that of the strategy. If I started with INR 1, then capital used for second day of experiment is INR 1 along with what was gained or lost after first day of experiment. This is then repeated. Chart below is the equity curve of this experimental strategy (without taking in account transaction costs, taxes etc.).

The experiment lost money consistently. There was hardly a time when the cumulative return was not under water. At the end of 10 years I would have been down by 84.1% while my imaginary buy & hold friend would be up by 241.5% !
These results leads me to think while making consistent return in Intra Day trading isn’t impossible, it’s certainly not the low hanging fruits or easy money on the table for grab. In fact, it could perhaps be one of the most difficult among the available options in trading, as it requires to constantly swim against the flow of larger trend in market which is on the upside.
Some food for thought: Could reversing the experiment i.e. selling at open and buying it back at close be a successful trading strategy? Well I leave the exploration to you. But be mindful to take into account the transaction charges, taxes etc. as it will require you to make daily entries & exits as you test out its performance.
Hope you found this article thought provoking & interesting. If you missed reading the previous issue of Dalal Street Rafting on TCS Buyback: A 20% return trade check it out below.

Disclaimer: Views presented in this article is personal opinion of author and doesn’t not represent any firm’s view that he is currently associated or might have been associated in the past. No part of it should not be considered as a recommendation to buy or sell any stocks etc. This is an educational article and although care has been taken for correctness of the data, author does not take any responsibility for any errors or omissions.
Thank for study and reply
Hi,
Did you study intraday return with following conditions 1. price should be more than 50 period and above 13 period on 15 min (as its intraday (ideally it should 5 min chart)) to buy and sell by 3 pm or price goes down 21 period of 15 min chart. As i do not have source and not having require skills to back test it, But pl. do it to know actual result on base of above condition, and i think that would give real picture