

Charting US Stock Market: Is the worst behind ?
Charting US Stock Market: Is the worst behind ?
Technical Analysis study on NASDAQ, S&P500 & Dow Jones to see what's happening under the hood


Read Time: 5 minutes
Today I am going to:
Share useful observations on DJIA, S&P500 & NASDAQ100 weekly charts
Identify strongest & weakest amongst them, and
Put forward few actionable investment insights
Last week US market saw a roller coaster of sentiments - on one hand GDP increased 2.6% last quarter beating estimate of 2.4% & Apple AAPL 0.00%↑ reported earnings which topped Wall Street targets. In contrast, all other big tech - Meta, Amazon, Microsoft & Alphabet combined lost $350 bn in market cap. Meta META 0.00%↑ deserves a special mention plunging 24% in the past 5 days, posting the worst week since its IPO in 2012.
But, underneath these wild swings of stock prices some early cues are beginning to emerge.
While Indian markets was basking in the sun of its relative outperformance globally, US markets have staged some sort of bounce from spurt of momentum evident from the last 30 days & 1 week returns. More than often these bounces are short covering having short life, being nothing more than traps for the BTFD (Buy The Fricking Dip) guy. So I decided to look more closely at their charts to find any reasonable evidence in case the situation here is otherwise.
Note: Tapping on any image (like charts etc.) will zoom them out for a clearer & better viewing experience.
NASDAQ 100 - The weakest

What makes this weekly NASDAQ 100 chart interesting:
Last 12 year has correction has bought the index to 61.8% retracement from its COVID bottom in 2020
Momentum Divergence has begun to emerge. In plain English - fall in price is decelerating.
A falling & broadening wedge pattern is emerging. While its premature, such structure are more likely to breakout on the upside, when they do eventually.
S&P 500: The moderate
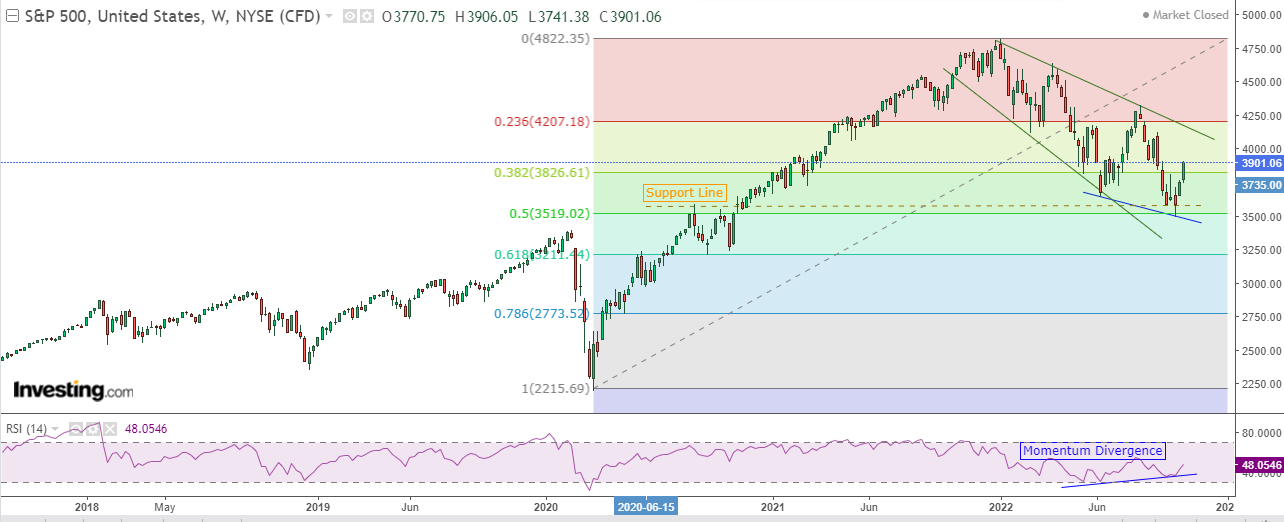
Key points standing out for S&P500 on its weekly chart:
This index has retraced 50% of the COVID bull run. Interestingly it also coincides with a support line. While a tad less stronger than 61.8% retracement, this level has a reasonable strength to stop the fall in medium term.
Momentum divergence is emerging here too. In fact the ensuing candles from the Lower Low point on chart inspire more confidence that NASDAQ.
The premature broadening & falling wedge pattern surfaces here as well.
Dow Jones: The Strongest
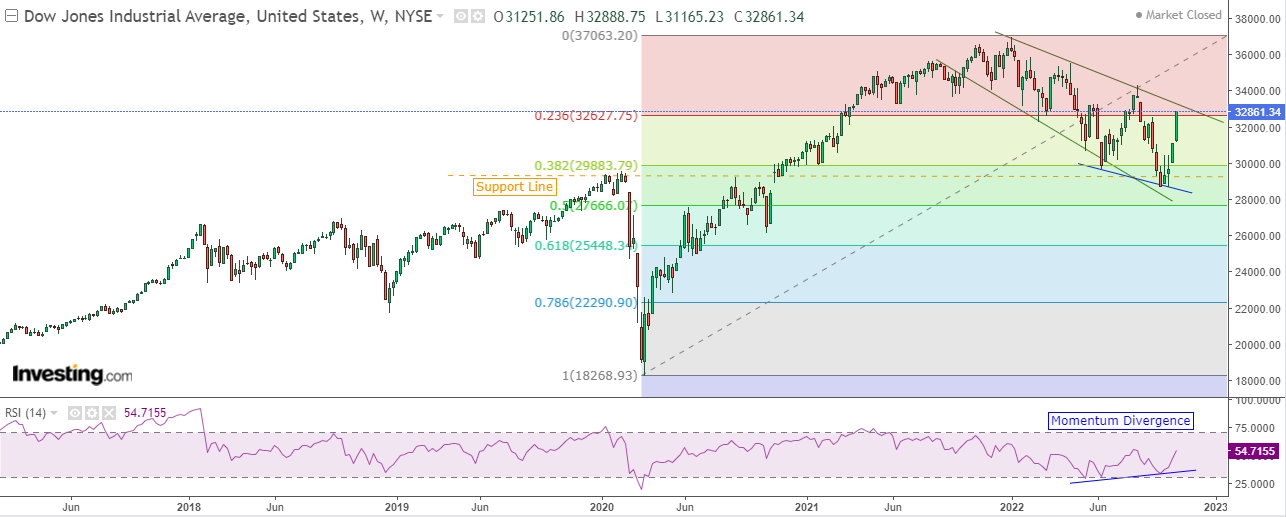
Highlights of DJIA (Dow Jones Industrial Average) weekly chart:
The correction coincides with 38.2% retracement. Which is also at the same level as Pre COVID high. Making it a strong support. Much stronger than in case of S&P 500.
RSI is just not displaying divergence but renewed momentum on the upside.
The falling wedge pattern is most prominent. The prices are on the verge of breaking out. Which when happens will confirm the change in market direction to the upside.
What to make out of these?
While Big Tech has enough negative views & narrative around it, getting short now is a blunder & staying short isn’t having favorable risk-reward to it anymore.
While that does not ensure positive momentum will return immediately in Tech (or NASDAQ), this is not a bad place to accumulate provided you have a 5-6 months horizon, at least.
Entire correction phase which started 12 months back led DJIA to retrace 38.2%. Next is S&P at 50% and most in NASDAQ 61.8% retracement from the COVID rally. Lesser the retracement, more the strength on the upside rally that follows.
Old economy stock are better placed to lead the recovery rally. If you are chasing momentum this is where you are more likely to strike gold.
If US market gets respite from making newer lows which these charts are beginning to point at, other economies around globe doing relatively better will just not hold but gain grounds.
Indian Markets has been an outperformer, but struggled to make absolute gains in last 12 months which can now begin to change. Watch out for ATH (all time high) here!
With all the negative factors like inflation, recessionary fears, rapid rate hikes, wars, geo-political tensions etc. its perhaps slightly difficult to make a fundamental bull case especially for US markets. But prices seems to suggest winds of change might have started blowing, already.
While a new Bull Market rally in US is far from obvious, at these levels there is more to gain than lose on the long side.
PS: I have done some similar analysis on NIFTY IT few days before Q2 results started flowing in.


Hope you found this article thought provoking & interesting. If you missed reading Samvat 2079: Anecdotes on Indian Economy, Trading, Investing and bonus book tips! by Dalal Street Rafting check it out below.

Disclaimer: Views presented in this article is personal opinion of author and doesn’t not represent any firm’s view that he is currently associated or might have been associated in the past. No part of it should not be considered as a recommendation to buy or sell any stocks etc. This is an educational article at best. Although care has been taken for correctness of the data, author does not take any responsibility for any errors or omissions. Readers should consult their financial advisers before taking investment decision.